Three (3) simple ways to start your business visual safety system in under an hour.
An extension of Qld Workplace Health and Safety’s recommended method for managing hazardous manual tasks. Participative Ergonomics for Manual Tasks – PErforM
As the saying goes, “what gets measured, gets managed” but for many small and medium business’s, developing and tracking the indicators of your safety performance can be overwhelming.
Where do you start?
A visual system to track the key safety metrics in your business need not be complicated or time consuming to set up and update. Follow our simple tips and grab our free template to get your self started today. You will find this simple technique will increase your teams engagement with the safety process and improve the safety in your workplace.
Simplicity is the Key
When you are just starting a business safety system to monitor your safety performance, simplicity is the key . In a report on implementing a safety system, the Safety Institute of Australia identify several features of a simple system. It should be:
- Easy to get up and running
- Easy to update
- Easy for you and your employees to understand
- Easy to change as your business grows and your safety maturity improves
What Makes up a Workplace Safety Dashboard?
Some of the best elements in a safety system can be sourced from Lean Management including:
- Safety Cross,
- Rash Map (Floor Plan or Body)
- Workplace Safety Dashboard
- Additional items to suit your business priorities
#1 – Safety Cross or Safety Calendar
A Safety cross or safety calendar is a simple chart with squares for each day of the month, that is updated at the beginning of every day. Staff reflect on the safety performance of the previous work day and colour the appropriate square in according to a predefined set of criteria.
The colour coding can be set up to highlight whatever is relevant to your business:

- At its simplest, a square is coloured red if there is an injury and green if it is a safe shift.
- If your business doesn’t have a lot of injuries then red could represent incidents or near misses.
- Orange could represent an issue found with a faulty piece of equipment or procedure,
- Blue could be to celebrate a safety improvement or milestone.
There are many possibilities and the idea is to set it up as a tool that is relevant to your business and employees to provide a visual indication of your safety performance. There are lots of versions online such as the one by KCOE or the one in the template attached to this blog (HERE).
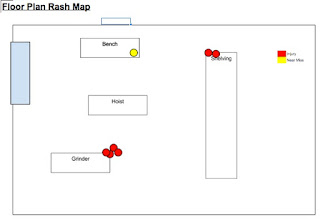
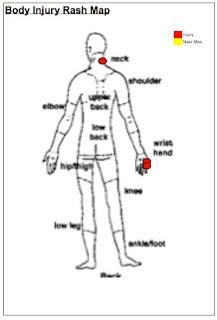
#2 – Rash Maps
With a rash map you put a dot or mark on the chart in the location where an injury or an incident occurs. The chart can represent either the workplace (Figure 2) or a person (Figure 3).
- Over time the dots will build to highlight areas of common problems that you can target for improvements.
- This is updated everyday with your team and can provide a powerful visual indication of where your safety issues are occurring.
- It might be a blind spot or low shelf that staff keep hitting their heads on, a piece of machinery that keeps nipping at fingers, a step that always catches people out.
All these issues you are no doubt aware of, but you might surprise yourself at how many injuries or near misses are actually occurring when you mark them down.
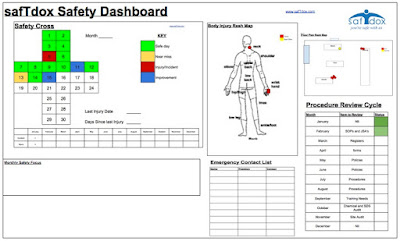
#3 – Bringing it all together – The Workplace Safety Dashboard
A Workplace Safety Dashboard is simply a grouping of your metrics, located in a visible place in the workplace to reinforce the key drivers in your business.
The content of your VMB is limited only by your imagination, and you can display anything that helps you monitor your business and convey key information to your staff. Figure 4 illustrates one example.
Additional items you might like to include on your VMB
- Emergency Contact list
- Procedure review list
- Monthly or weekly safety focus
- Important milestones or targets
- List of issues that require more detailed problem solving to resolve
Get all your employees involved at at the same time every day as you discuss the previous days safety performance and update the board. When updating the board with your team ask questions like:
- Were there any injuries, incidents or near misses yesterday?
- What did we do yesterday that improved safety in our workplace?
- What activity did we do that could have been been completed in a safer or more efficient manner?
- What are we going to focus on today that will improve our safety?
As you talk, you can mark up the board with the relevant information. Once done you can get on with your day with a clear frame of reference to what you need to do to stay safe. It does not need to take long, and the board will act as a visual prompt in your workplace.
Positive Performance Indicators (PPI) help you to identify the level of WHS maturity your business has reached. There are five stages of Organisation Maturity
- Pathological
- Reactive
- Calculative
- Proactive
- Generative
A key in moving along the stages of maturity is introducing a system to monitor your business’s safety metrics. The Workplace Safety Dashboard will do this for you.
What can I do Next?
Use the FREE template here to go and build your own safety Dashboard now. It will only take you ten minutes to print out and find a blank space on the wall to stick up the sheets.
Then use it, EVERYDAY.
You will find it will only take a few minutes, but you will be surprised at how such a simple visual system can lift the focus of yourself and your employees towards a safer work environment.
Do you currently use a Workplace safety dashboard? We would love to hear what you do or any tips you have used to increase workforce engagement! Please comment below and share with our community.
Tom Connor is a Process Engineer (the useless kind of Engineer according to his better half and kids!) with an extensive background in Lean manufacturing, problem solving, safety Leadership and system development. You can contact him at tomconnor@outlook.com or via linkedin
WorkCover Queensland now has online dashboards availalbe to business owners. Click here to view.